
Introducing... Aivia 5
The advent of 3D light microscopy in the late 1980s enabled a wave of new groundbreaking discoveries in biology and medicine. Today, virtual, augmented and mixed reality tools are poised to help researchers and physicians push the boundaries of knowledge and improve healthcare, respectively. We are pioneering the latest virtual reality (VR) technology in order to bring you - the scientific and medical community - the benefits of immersive image visualization and analysis.
Machine and deep learning, enabled by modern GPUs, are now viable alternatives to standard image processing approaches - with the advantage of gradually becoming more efficient and accurate at identifying patterns of interest. Our company has been developing machine learning tools since the 1990s and currently holds several patented solutions. While we continue to explore the limits of machine learning and deep learning we made our most successful tools available to you in Aivia 5.


Neuron Detection
Aivia 5 - Automatic Neuron Detection and Analysis

Aivia 5 - Automatic Neuron Detection and Analysis
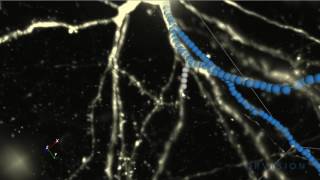
Aivia 5 - Dendrite Tracing
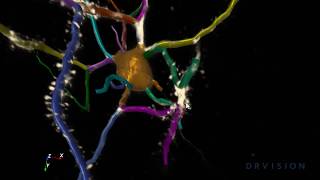
Aivia 5 - Dendrite Editing
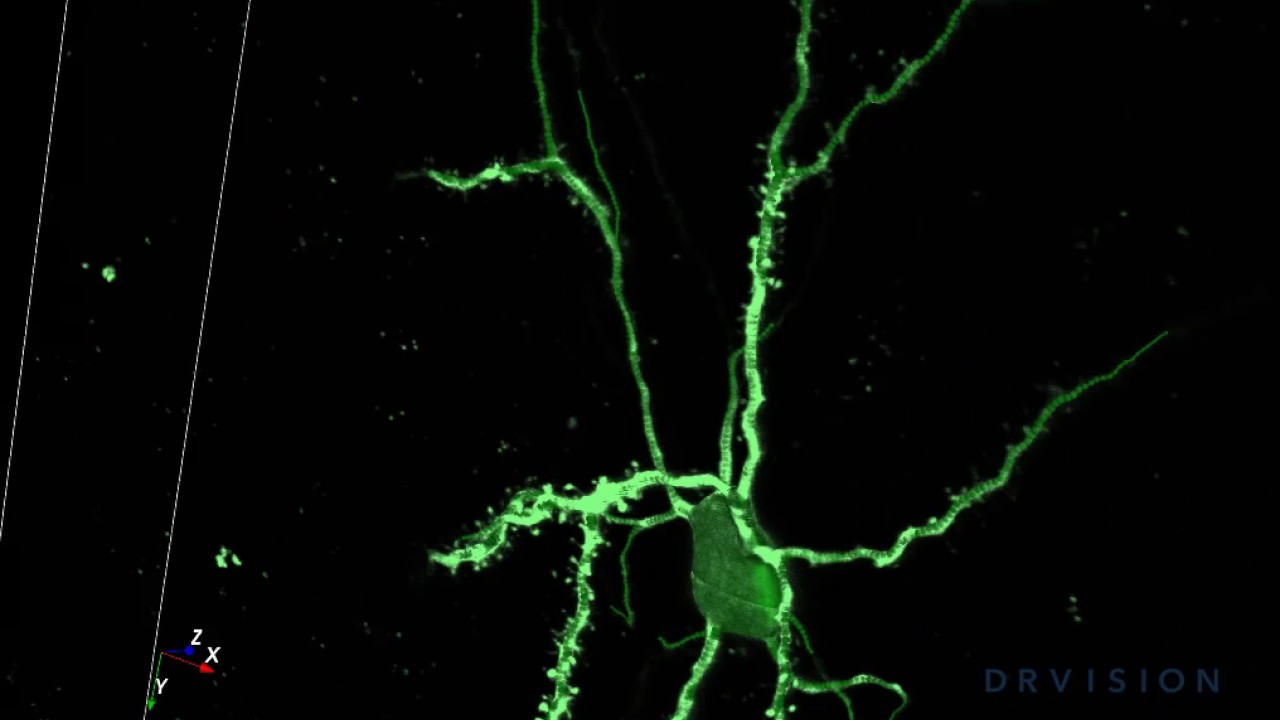
Automatic 3D Neuron Detection and Analysis
Fast and automated neuron detection in 3D datasets can now be accomplished with Aivia. With a few key parameters, Aivia detects all somas and traces their dendrites within a 3D dataset in less than 25 seconds (for a 2k x 2k x 500, 1 GB data set). Neurons can be rendered in different view modes according to your preference and our neuron pencil tools save you time and effort when you need to edit or semi-automatically trace dendrites in 3D.
Aivia automatically calculates a wide range measurements, ensuring you extract all the information from your images. Measurements such as neuron and dendrite counts as well as dendrite diameter, length, branch angle are easily obtained. Aivia offers over 70 statistical measurements on dendritic arbors, allowing you to delve into the data more effectively.

Neuron Classification
Classify Neurons With Ease
Assessing the frequency of each neuron type present in your sample as well as their spatial distribution and morphological characteristics may allow you to generate blueprints for developmental stages and certain diseases. Using the taught classifiers in Aivia (Mouse, Rat and Human) you can easily identify 8 major types of neurons in your sample (Chandelier, Granule, Motorneuron, Purkinje, Pyramidal, Stellate, Tripolar, and Spindle). Teaching for these classifiers was done using a sample of neuron reconstructions from the reference repository, NeuroMorpho.Org . These classifiers are free and open source.
Classifiers can be further enhanced with additional data from you or your collaborators. Aivia 5 also provides you with the flexibility to build your own classifier from cells detected with Aivia. In addition, it can import *.swc, *.vrml and *.iv neuron reconstructions - this way you can use reconstructions you have created in other neuron tracing tools to teach and apply machine learning powered cell classifiers in Aivia.
# Ascoli, Giorgio A. "Mobilizing the base of neuroscience data: the case of neuronal morphologies." Nature Reviews Neuroscience 7.4 (2006); 318-324.
#

Virtual Reality Visualization
State of Art Immersive Visualization and Interaction
View and interact with your 3D and 4D data in virtual reality. Aivia 5 coupled with HTC Vive system provides a seamless experience. Combined with Aivia 5 detection, you can now directly interact with your data. Segmented objects can be relocated to view how potential physical changes affect the network. Objects can be closely examined and compared side-by-side.
Learn more about immersive image visualization and interaction by reviewing the recording and Q&A transcript of our recent live webinar. Presented by the lead engineer working on our VR solution (Bryce Graff) and our VP (Luciano Lucas).

Send us your images
Please fill in your contact details and tell us more about your research
Tel: 1-855-423-5577
15405 SE 37th St, Ste 100
Bellevue, WA 98006